Plotting with Matplotlib and Cartopy#
In addition to supporting the HoloViz ecosystem of plotting packages via the .plot() accessors, UXarray also provides functionality to represent unstructured grids in formats that are accepted by Matplotlib and Cartopy.
This guide covers:
Rasterizing Data onto a Cartopy
GeoAxesVisualizing Data with
PolyCollectionVisualizing Grid Topology with
LineCollection
import cartopy.crs as ccrs
import cartopy.feature as cfeature
import matplotlib.pyplot as plt
from cartopy.crs import PlateCarree

import uxarray as ux
base_path = "../../test/meshfiles/mpas/QU/480/"
grid_path = base_path + "grid.nc"
data_path = base_path + "data.nc"

uxds = ux.open_dataset(grid_path, data_path)
Matplotlib and Cartopy Background#
To support Matplotlib and Cartopy workflows, UXarray has chosen to provide the necessary conversion functions to represent unstructured grids in formats that can be interpreted by these packages. This means that you as the user are responsible for setting up the figure, adding colorbar, and configuring other aspects of the plotting workflow. Because of this, we will not cover these topics in detail, but reccomend reviewing the following resources:
Rasterization#
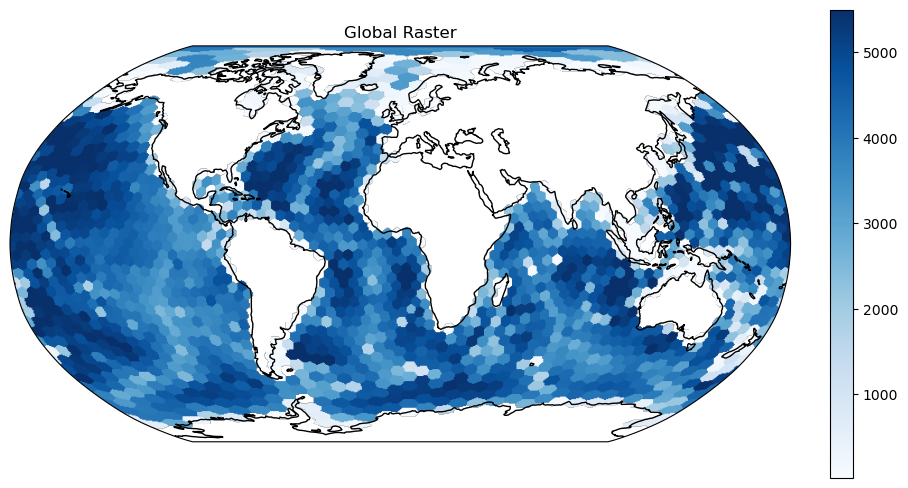
UXarray can rapidly translate face-centered data into a raster image that can be displayed directly on a Cartopy GeoAxes.
UXarray currently supports a nearest-neighbor based rasterization method, which converts each screen-space pixel from the GeoAxes into a geographic coordinate for sampling the underlying unstructured grid. If the pixel lies within a face in the unstructured grid, it is shaded by the corresponding face value.
The result is a 2-D array that works seamlessly with Matplotlib’s imshow, contour, contourf and other visualization functions.
Important
Since the core geometry routines used internally directly sample the underlying unstructured grid using Numba, rasterization is extremely fast, even on high-resolution unstructured grids
Displaying Rasterized Data with ax.imshow()#
Because rasterization yields a fully georeferenced two-dimensional array, the quickest way to render it is with Matplotlib’s Axes.imshow() on a Cartopy GeoAxes. By supplying the raster array along with the appropriate origin and extent parameters, Cartopy automatically handles projection and alignment.
Caution
When rasterizing a grid at a global extent, especially at higher resolutions, there may not be enough pixels to sample the entire grid thouroughly. You can consider increasing the figure size if you need more pixels.
fig, ax = plt.subplots(
    subplot_kw={"projection": ccrs.Robinson()}, figsize=(9, 6), constrained_layout=True
)

ax.set_global()

raster = uxds["bottomDepth"].to_raster(ax=ax)
img = ax.imshow(
    raster, cmap="Blues", origin="lower", extent=ax.get_xlim() + ax.get_ylim()
)
ax.set_title("Global Raster")
ax.coastlines()

# Adding a colorbar (the examples below will not include one to keep things concise)
cbar = fig.colorbar(img, ax=ax, fraction=0.03)
/home/docs/checkouts/readthedocs.org/user_builds/uxarray/conda/1321/lib/python3.13/site-packages/uxarray/grid/point_in_face.py:168: NumbaPerformanceWarning: np.dot() is faster on contiguous arrays, called on (Array(float64, 1, 'C', False, aligned=True), Array(float64, 1, 'A', False, aligned=True))
  hits = _get_faces_containing_point(
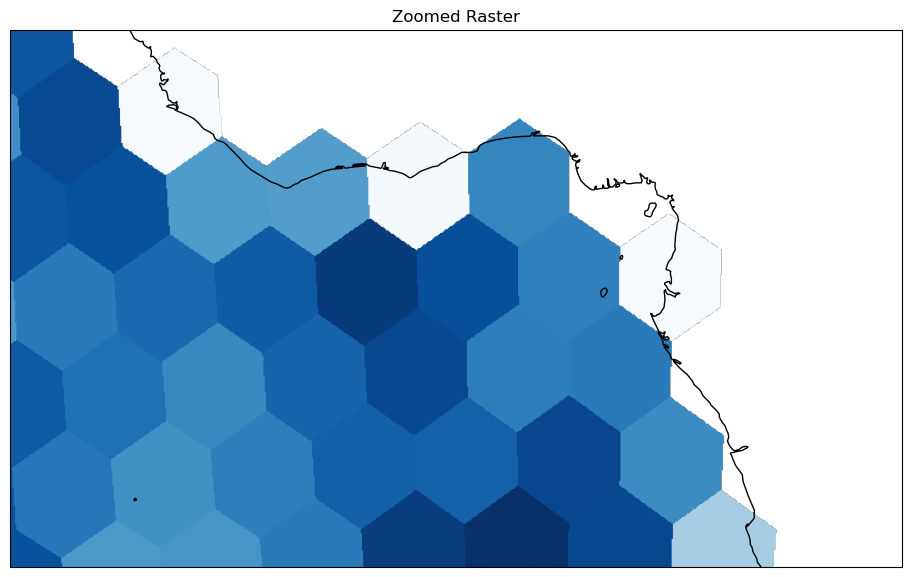
When you only need to visualize a subset of your data, such as a country, basin, or smaller study area, limiting the extent of the Cartopy GeoAxes before rasterization can significantly improve performance. By setting a tighter longitude-latitude window, the pixel-to-face lookups are constrained to that region, reducing the overall number of queries. This targeted sampling speeds up rendering, lowers memory overhead, and produces a cleaner, more focused map of your area of interest.
fig, ax = plt.subplots(
    subplot_kw={"projection": ccrs.Robinson()}, figsize=(9, 6), constrained_layout=True
)

ax.set_extent((-20, 20, -10, 10))


raster = uxds["bottomDepth"].to_raster(ax=ax)
ax.imshow(raster, cmap="Blues", origin="lower", extent=ax.get_xlim() + ax.get_ylim())
ax.set_title("Zoomed Raster")
ax.coastlines()
<cartopy.mpl.feature_artist.FeatureArtist at 0x7ab99d70a350>
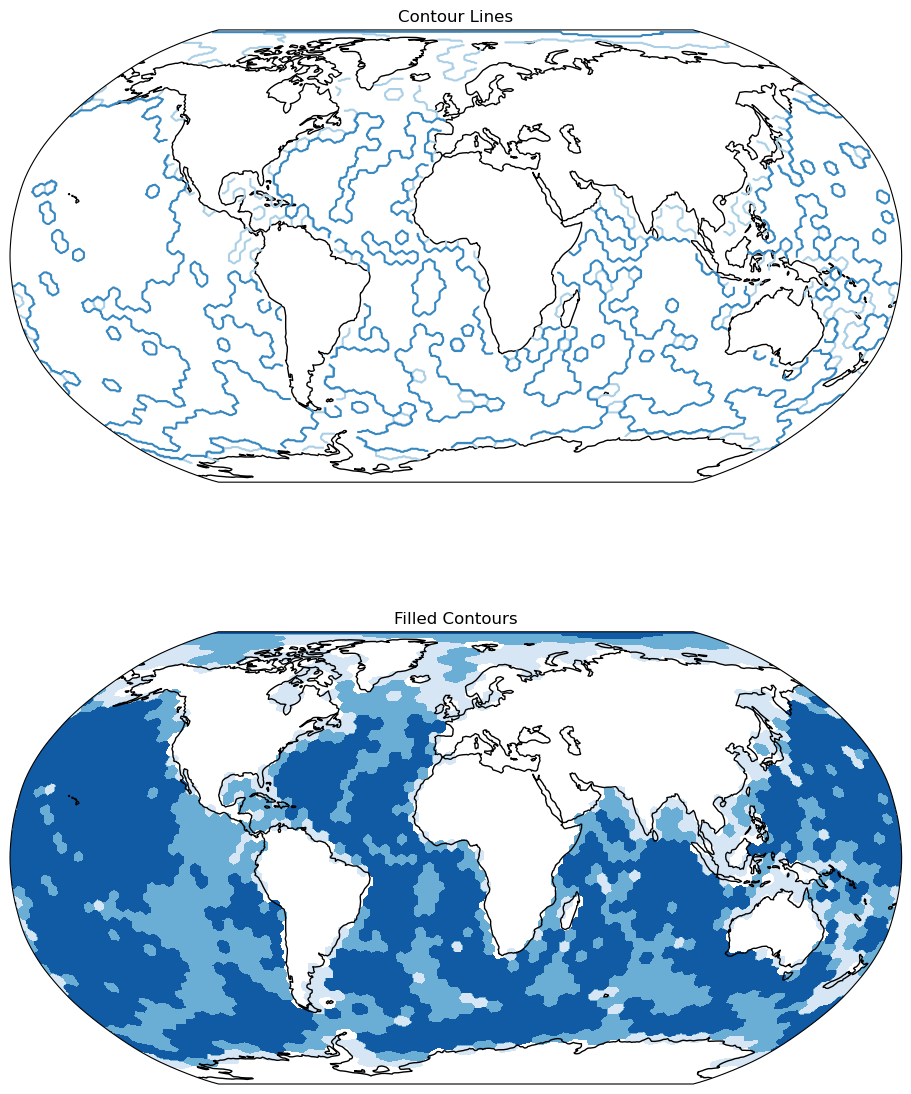
Viewing Contours with ax.contour() and ax.contourf()#
You can use ax.contour() to draw projection-aware isolines and ax.contourf() to shade between levels, specifying either a contour count or explicit thresholds.
Warning
The contours are generated on the raster image, not the unstructured grid geometries, which may create misleading results if not enough pixels were sampled.
levels = [0, 2000, 4000, 6000]
fig, axes = plt.subplots(
    2,
    1,
    subplot_kw={"projection": ccrs.Robinson()},
    constrained_layout=True,
    figsize=(9, 12),
)

ax1, ax2 = axes

ax1.set_global()
ax2.set_global()

ax1.coastlines()
ax2.coastlines()

raster = uxds["bottomDepth"].to_raster(ax=ax1)

# Contour Lines
ax1.contour(
    raster,
    cmap="Blues",
    origin="lower",
    extent=ax1.get_xlim() + ax1.get_ylim(),
    levels=levels,
)
ax1.set_title("Contour Lines")

# Filled Contours
ax2.contourf(
    raster,
    cmap="Blues",
    origin="lower",
    extent=ax2.get_xlim() + ax2.get_ylim(),
    levels=levels,
)
ax2.set_title("Filled Contours")
Text(0.5, 1.0, 'Filled Contours')
Matplotlib Collections#
Instead of directly sampling the unstructured grid, UXarray supports converting the grid into two matplotlib.collections classes: PolyCollection and LineCollection
Warning
It is reccomended to only use these collection-based plotting workflows if your grid is relatively small. For higher-resolution grids, directly rasterizing will almost always produce quicker results.
Visualize Data with PolyCollection#
To visualize face-centered data variables, you can convert a UxDataArray into a PolyCollection, which represents each face as a polygon, shaded by its corresponding data value.
poly_collection = uxds["bottomDepth"].to_polycollection()
# disables grid lines
poly_collection.set_antialiased(False)

poly_collection.set_cmap("Blues")

fig, ax = plt.subplots(
    1,
    1,
    facecolor="w",
    constrained_layout=True,
    subplot_kw=dict(projection=ccrs.Robinson()),
)

ax.add_feature(cfeature.COASTLINE)
ax.add_feature(cfeature.BORDERS)

ax.add_collection(poly_collection)
ax.set_global()
plt.title("PolyCollection")
---------------------------------------------------------------------------
GEOSException                             Traceback (most recent call last)
Cell In[8], line 17
     14 ax.add_feature(cfeature.COASTLINE)
     15 ax.add_feature(cfeature.BORDERS)
---> 17 ax.add_collection(poly_collection)
     18 ax.set_global()
     19 plt.title("PolyCollection")

File ~/checkouts/readthedocs.org/user_builds/uxarray/conda/1321/lib/python3.13/site-packages/matplotlib/axes/_base.py:2367, in _AxesBase.add_collection(self, collection, autolim)
   2363 if autolim:
   2364     # Make sure viewLim is not stale (mostly to match
   2365     # pre-lazy-autoscale behavior, which is not really better).
   2366     self._unstale_viewLim()
-> 2367     datalim = collection.get_datalim(self.transData)
   2368     points = datalim.get_points()
   2369     if not np.isinf(datalim.minpos).all():
   2370         # By definition, if minpos (minimum positive value) is set
   2371         # (i.e., non-inf), then min(points) <= minpos <= max(points),
   2372         # and minpos would be superfluous. However, we add minpos to
   2373         # the call so that self.dataLim will update its own minpos.
   2374         # This ensures that log scales see the correct minimum.

File ~/checkouts/readthedocs.org/user_builds/uxarray/conda/1321/lib/python3.13/site-packages/matplotlib/collections.py:273, in Collection.get_datalim(self, transData)
    270     return transforms.Bbox.null()
    272 if not transform.is_affine:
--> 273     paths = [transform.transform_path_non_affine(p) for p in paths]
    274     # Don't convert transform to transform.get_affine() here because
    275     # we may have transform.contains_branch(transData) but not
    276     # transforms.get_affine().contains_branch(transData).  But later,
    277     # be careful to only apply the affine part that remains.
    279 offsets = self.get_offsets()

File ~/checkouts/readthedocs.org/user_builds/uxarray/conda/1321/lib/python3.13/site-packages/matplotlib/transforms.py:2427, in CompositeGenericTransform.transform_path_non_affine(self, path)
   2425     return path
   2426 elif not self._a.is_affine and self._b.is_affine:
-> 2427     return self._a.transform_path_non_affine(path)
   2428 else:
   2429     return self._b.transform_path_non_affine(
   2430                             self._a.transform_path(path))

File ~/checkouts/readthedocs.org/user_builds/uxarray/conda/1321/lib/python3.13/site-packages/cartopy/mpl/geoaxes.py:174, in InterProjectionTransform.transform_path_non_affine(self, src_path)
    171     return mpath.Path(self.transform(src_path.vertices))
    173 geom = cpath.path_to_shapely(src_path)
--> 174 transformed_geom = self.target_projection.project_geometry(
    175     geom, self.source_projection)
    177 result = cpath.shapely_to_path(transformed_geom)
    179 # store the result in the cache for future performance boosts

File ~/checkouts/readthedocs.org/user_builds/uxarray/conda/1321/lib/python3.13/site-packages/cartopy/crs.py:833, in Projection.project_geometry(self, geometry, src_crs)
    831 if not method_name:
    832     raise ValueError(f'Unsupported geometry type {geom_type!r}')
--> 833 return getattr(self, method_name)(geometry, src_crs)

File ~/checkouts/readthedocs.org/user_builds/uxarray/conda/1321/lib/python3.13/site-packages/cartopy/crs.py:836, in Projection._project_point(self, point, src_crs)
    835 def _project_point(self, point, src_crs):
--> 836     return sgeom.Point(*self.transform_point(point.x, point.y, src_crs))

File ~/checkouts/readthedocs.org/user_builds/uxarray/conda/1321/lib/python3.13/site-packages/shapely/geometry/point.py:91, in Point.x(self)
     88 @property
     89 def x(self):
     90     """Return x coordinate."""
---> 91     return float(shapely.get_x(self))

File ~/checkouts/readthedocs.org/user_builds/uxarray/conda/1321/lib/python3.13/site-packages/shapely/decorators.py:88, in multithreading_enabled.<locals>.wrapped(*args, **kwargs)
     86     for arr in array_args:
     87         arr.flags.writeable = False
---> 88     return func(*args, **kwargs)
     89 finally:
     90     for arr, old_flag in zip(array_args, old_flags):

File ~/checkouts/readthedocs.org/user_builds/uxarray/conda/1321/lib/python3.13/site-packages/shapely/_geometry.py:298, in get_x(point, **kwargs)
    273 @multithreading_enabled
    274 def get_x(point, **kwargs):
    275     """Return the x-coordinate of a point.
    276
    277     Parameters
   (...)    296
    297     """
--> 298     return lib.get_x(point, **kwargs)

GEOSException: UnsupportedOperationException: getX called on empty Point
Error in callback <function _draw_all_if_interactive at 0x7ab9d614f060> (for post_execute), with arguments args (),kwargs {}:
---------------------------------------------------------------------------
GEOSException                             Traceback (most recent call last)
File ~/checkouts/readthedocs.org/user_builds/uxarray/conda/1321/lib/python3.13/site-packages/matplotlib/pyplot.py:279, in _draw_all_if_interactive()
    277 def _draw_all_if_interactive() -> None:
    278     if matplotlib.is_interactive():
--> 279         draw_all()

File ~/checkouts/readthedocs.org/user_builds/uxarray/conda/1321/lib/python3.13/site-packages/matplotlib/_pylab_helpers.py:131, in Gcf.draw_all(cls, force)
    129 for manager in cls.get_all_fig_managers():
    130     if force or manager.canvas.figure.stale:
--> 131         manager.canvas.draw_idle()

File ~/checkouts/readthedocs.org/user_builds/uxarray/conda/1321/lib/python3.13/site-packages/matplotlib/backend_bases.py:1893, in FigureCanvasBase.draw_idle(self, *args, **kwargs)
   1891 if not self._is_idle_drawing:
   1892     with self._idle_draw_cntx():
-> 1893         self.draw(*args, **kwargs)

File ~/checkouts/readthedocs.org/user_builds/uxarray/conda/1321/lib/python3.13/site-packages/matplotlib/backends/backend_agg.py:382, in FigureCanvasAgg.draw(self)
    379 # Acquire a lock on the shared font cache.
    380 with (self.toolbar._wait_cursor_for_draw_cm() if self.toolbar
    381       else nullcontext()):
--> 382     self.figure.draw(self.renderer)
    383     # A GUI class may be need to update a window using this draw, so
    384     # don't forget to call the superclass.
    385     super().draw()

File ~/checkouts/readthedocs.org/user_builds/uxarray/conda/1321/lib/python3.13/site-packages/matplotlib/artist.py:94, in _finalize_rasterization.<locals>.draw_wrapper(artist, renderer, *args, **kwargs)
     92 @wraps(draw)
     93 def draw_wrapper(artist, renderer, *args, **kwargs):
---> 94     result = draw(artist, renderer, *args, **kwargs)
     95     if renderer._rasterizing:
     96         renderer.stop_rasterizing()

File ~/checkouts/readthedocs.org/user_builds/uxarray/conda/1321/lib/python3.13/site-packages/matplotlib/artist.py:71, in allow_rasterization.<locals>.draw_wrapper(artist, renderer)
     68     if artist.get_agg_filter() is not None:
     69         renderer.start_filter()
---> 71     return draw(artist, renderer)
     72 finally:
     73     if artist.get_agg_filter() is not None:

File ~/checkouts/readthedocs.org/user_builds/uxarray/conda/1321/lib/python3.13/site-packages/matplotlib/figure.py:3257, in Figure.draw(self, renderer)
   3254             # ValueError can occur when resizing a window.
   3256     self.patch.draw(renderer)
-> 3257     mimage._draw_list_compositing_images(
   3258         renderer, self, artists, self.suppressComposite)
   3260     renderer.close_group('figure')
   3261 finally:

File ~/checkouts/readthedocs.org/user_builds/uxarray/conda/1321/lib/python3.13/site-packages/matplotlib/image.py:134, in _draw_list_compositing_images(renderer, parent, artists, suppress_composite)
    132 if not_composite or not has_images:
    133     for a in artists:
--> 134         a.draw(renderer)
    135 else:
    136     # Composite any adjacent images together
    137     image_group = []

File ~/checkouts/readthedocs.org/user_builds/uxarray/conda/1321/lib/python3.13/site-packages/matplotlib/artist.py:71, in allow_rasterization.<locals>.draw_wrapper(artist, renderer)
     68     if artist.get_agg_filter() is not None:
     69         renderer.start_filter()
---> 71     return draw(artist, renderer)
     72 finally:
     73     if artist.get_agg_filter() is not None:

File ~/checkouts/readthedocs.org/user_builds/uxarray/conda/1321/lib/python3.13/site-packages/cartopy/mpl/geoaxes.py:509, in GeoAxes.draw(self, renderer, **kwargs)
    504         self.imshow(img, extent=extent, origin=origin,
    505                     transform=factory.crs, *factory_args[1:],
    506                     **factory_kwargs)
    507 self._done_img_factory = True
--> 509 return super().draw(renderer=renderer, **kwargs)

File ~/checkouts/readthedocs.org/user_builds/uxarray/conda/1321/lib/python3.13/site-packages/matplotlib/artist.py:71, in allow_rasterization.<locals>.draw_wrapper(artist, renderer)
     68     if artist.get_agg_filter() is not None:
     69         renderer.start_filter()
---> 71     return draw(artist, renderer)
     72 finally:
     73     if artist.get_agg_filter() is not None:

File ~/checkouts/readthedocs.org/user_builds/uxarray/conda/1321/lib/python3.13/site-packages/matplotlib/axes/_base.py:3226, in _AxesBase.draw(self, renderer)
   3223 if artists_rasterized:
   3224     _draw_rasterized(self.get_figure(root=True), artists_rasterized, renderer)
-> 3226 mimage._draw_list_compositing_images(
   3227     renderer, self, artists, self.get_figure(root=True).suppressComposite)
   3229 renderer.close_group('axes')
   3230 self.stale = False

File ~/checkouts/readthedocs.org/user_builds/uxarray/conda/1321/lib/python3.13/site-packages/matplotlib/image.py:134, in _draw_list_compositing_images(renderer, parent, artists, suppress_composite)
    132 if not_composite or not has_images:
    133     for a in artists:
--> 134         a.draw(renderer)
    135 else:
    136     # Composite any adjacent images together
    137     image_group = []

File ~/checkouts/readthedocs.org/user_builds/uxarray/conda/1321/lib/python3.13/site-packages/matplotlib/artist.py:71, in allow_rasterization.<locals>.draw_wrapper(artist, renderer)
     68     if artist.get_agg_filter() is not None:
     69         renderer.start_filter()
---> 71     return draw(artist, renderer)
     72 finally:
     73     if artist.get_agg_filter() is not None:

File ~/checkouts/readthedocs.org/user_builds/uxarray/conda/1321/lib/python3.13/site-packages/matplotlib/collections.py:1008, in _CollectionWithSizes.draw(self, renderer)
   1005 @artist.allow_rasterization
   1006 def draw(self, renderer):
   1007     self.set_sizes(self._sizes, self.get_figure(root=True).dpi)
-> 1008     super().draw(renderer)

File ~/checkouts/readthedocs.org/user_builds/uxarray/conda/1321/lib/python3.13/site-packages/matplotlib/artist.py:71, in allow_rasterization.<locals>.draw_wrapper(artist, renderer)
     68     if artist.get_agg_filter() is not None:
     69         renderer.start_filter()
---> 71     return draw(artist, renderer)
     72 finally:
     73     if artist.get_agg_filter() is not None:

File ~/checkouts/readthedocs.org/user_builds/uxarray/conda/1321/lib/python3.13/site-packages/matplotlib/collections.py:360, in Collection.draw(self, renderer)
    356 renderer.open_group(self.__class__.__name__, self.get_gid())
    358 self.update_scalarmappable()
--> 360 transform, offset_trf, offsets, paths = self._prepare_points()
    362 gc = renderer.new_gc()
    363 self._set_gc_clip(gc)

File ~/checkouts/readthedocs.org/user_builds/uxarray/conda/1321/lib/python3.13/site-packages/matplotlib/collections.py:337, in Collection._prepare_points(self)
    334     offsets = np.ma.column_stack([xs, ys])
    336 if not transform.is_affine:
--> 337     paths = [transform.transform_path_non_affine(path)
    338              for path in paths]
    339     transform = transform.get_affine()
    340 if not offset_trf.is_affine:

File ~/checkouts/readthedocs.org/user_builds/uxarray/conda/1321/lib/python3.13/site-packages/matplotlib/transforms.py:2427, in CompositeGenericTransform.transform_path_non_affine(self, path)
   2425     return path
   2426 elif not self._a.is_affine and self._b.is_affine:
-> 2427     return self._a.transform_path_non_affine(path)
   2428 else:
   2429     return self._b.transform_path_non_affine(
   2430                             self._a.transform_path(path))

File ~/checkouts/readthedocs.org/user_builds/uxarray/conda/1321/lib/python3.13/site-packages/cartopy/mpl/geoaxes.py:174, in InterProjectionTransform.transform_path_non_affine(self, src_path)
    171     return mpath.Path(self.transform(src_path.vertices))
    173 geom = cpath.path_to_shapely(src_path)
--> 174 transformed_geom = self.target_projection.project_geometry(
    175     geom, self.source_projection)
    177 result = cpath.shapely_to_path(transformed_geom)
    179 # store the result in the cache for future performance boosts

File ~/checkouts/readthedocs.org/user_builds/uxarray/conda/1321/lib/python3.13/site-packages/cartopy/crs.py:833, in Projection.project_geometry(self, geometry, src_crs)
    831 if not method_name:
    832     raise ValueError(f'Unsupported geometry type {geom_type!r}')
--> 833 return getattr(self, method_name)(geometry, src_crs)

File ~/checkouts/readthedocs.org/user_builds/uxarray/conda/1321/lib/python3.13/site-packages/cartopy/crs.py:836, in Projection._project_point(self, point, src_crs)
    835 def _project_point(self, point, src_crs):
--> 836     return sgeom.Point(*self.transform_point(point.x, point.y, src_crs))

File ~/checkouts/readthedocs.org/user_builds/uxarray/conda/1321/lib/python3.13/site-packages/shapely/geometry/point.py:91, in Point.x(self)
     88 @property
     89 def x(self):
     90     """Return x coordinate."""
---> 91     return float(shapely.get_x(self))

File ~/checkouts/readthedocs.org/user_builds/uxarray/conda/1321/lib/python3.13/site-packages/shapely/decorators.py:88, in multithreading_enabled.<locals>.wrapped(*args, **kwargs)
     86     for arr in array_args:
     87         arr.flags.writeable = False
---> 88     return func(*args, **kwargs)
     89 finally:
     90     for arr, old_flag in zip(array_args, old_flags):

File ~/checkouts/readthedocs.org/user_builds/uxarray/conda/1321/lib/python3.13/site-packages/shapely/_geometry.py:298, in get_x(point, **kwargs)
    273 @multithreading_enabled
    274 def get_x(point, **kwargs):
    275     """Return the x-coordinate of a point.
    276
    277     Parameters
   (...)    296
    297     """
--> 298     return lib.get_x(point, **kwargs)

GEOSException: UnsupportedOperationException: getX called on empty Point
---------------------------------------------------------------------------
GEOSException                             Traceback (most recent call last)
File ~/checkouts/readthedocs.org/user_builds/uxarray/conda/1321/lib/python3.13/site-packages/IPython/core/formatters.py:402, in BaseFormatter.__call__(self, obj)
    400     pass
    401 else:
--> 402     return printer(obj)
    403 # Finally look for special method names
    404 method = get_real_method(obj, self.print_method)

File ~/checkouts/readthedocs.org/user_builds/uxarray/conda/1321/lib/python3.13/site-packages/IPython/core/pylabtools.py:170, in print_figure(fig, fmt, bbox_inches, base64, **kwargs)
    167     from matplotlib.backend_bases import FigureCanvasBase
    168     FigureCanvasBase(fig)
--> 170 fig.canvas.print_figure(bytes_io, **kw)
    171 data = bytes_io.getvalue()
    172 if fmt == 'svg':

File ~/checkouts/readthedocs.org/user_builds/uxarray/conda/1321/lib/python3.13/site-packages/matplotlib/backend_bases.py:2157, in FigureCanvasBase.print_figure(self, filename, dpi, facecolor, edgecolor, orientation, format, bbox_inches, pad_inches, bbox_extra_artists, backend, **kwargs)
   2154     # we do this instead of `self.figure.draw_without_rendering`
   2155     # so that we can inject the orientation
   2156     with getattr(renderer, "_draw_disabled", nullcontext)():
-> 2157         self.figure.draw(renderer)
   2158 if bbox_inches:
   2159     if bbox_inches == "tight":

File ~/checkouts/readthedocs.org/user_builds/uxarray/conda/1321/lib/python3.13/site-packages/matplotlib/artist.py:94, in _finalize_rasterization.<locals>.draw_wrapper(artist, renderer, *args, **kwargs)
     92 @wraps(draw)
     93 def draw_wrapper(artist, renderer, *args, **kwargs):
---> 94     result = draw(artist, renderer, *args, **kwargs)
     95     if renderer._rasterizing:
     96         renderer.stop_rasterizing()

File ~/checkouts/readthedocs.org/user_builds/uxarray/conda/1321/lib/python3.13/site-packages/matplotlib/artist.py:71, in allow_rasterization.<locals>.draw_wrapper(artist, renderer)
     68     if artist.get_agg_filter() is not None:
     69         renderer.start_filter()
---> 71     return draw(artist, renderer)
     72 finally:
     73     if artist.get_agg_filter() is not None:

File ~/checkouts/readthedocs.org/user_builds/uxarray/conda/1321/lib/python3.13/site-packages/matplotlib/figure.py:3257, in Figure.draw(self, renderer)
   3254             # ValueError can occur when resizing a window.
   3256     self.patch.draw(renderer)
-> 3257     mimage._draw_list_compositing_images(
   3258         renderer, self, artists, self.suppressComposite)
   3260     renderer.close_group('figure')
   3261 finally:

File ~/checkouts/readthedocs.org/user_builds/uxarray/conda/1321/lib/python3.13/site-packages/matplotlib/image.py:134, in _draw_list_compositing_images(renderer, parent, artists, suppress_composite)
    132 if not_composite or not has_images:
    133     for a in artists:
--> 134         a.draw(renderer)
    135 else:
    136     # Composite any adjacent images together
    137     image_group = []

File ~/checkouts/readthedocs.org/user_builds/uxarray/conda/1321/lib/python3.13/site-packages/matplotlib/artist.py:71, in allow_rasterization.<locals>.draw_wrapper(artist, renderer)
     68     if artist.get_agg_filter() is not None:
     69         renderer.start_filter()
---> 71     return draw(artist, renderer)
     72 finally:
     73     if artist.get_agg_filter() is not None:

File ~/checkouts/readthedocs.org/user_builds/uxarray/conda/1321/lib/python3.13/site-packages/cartopy/mpl/geoaxes.py:509, in GeoAxes.draw(self, renderer, **kwargs)
    504         self.imshow(img, extent=extent, origin=origin,
    505                     transform=factory.crs, *factory_args[1:],
    506                     **factory_kwargs)
    507 self._done_img_factory = True
--> 509 return super().draw(renderer=renderer, **kwargs)

File ~/checkouts/readthedocs.org/user_builds/uxarray/conda/1321/lib/python3.13/site-packages/matplotlib/artist.py:71, in allow_rasterization.<locals>.draw_wrapper(artist, renderer)
     68     if artist.get_agg_filter() is not None:
     69         renderer.start_filter()
---> 71     return draw(artist, renderer)
     72 finally:
     73     if artist.get_agg_filter() is not None:

File ~/checkouts/readthedocs.org/user_builds/uxarray/conda/1321/lib/python3.13/site-packages/matplotlib/axes/_base.py:3226, in _AxesBase.draw(self, renderer)
   3223 if artists_rasterized:
   3224     _draw_rasterized(self.get_figure(root=True), artists_rasterized, renderer)
-> 3226 mimage._draw_list_compositing_images(
   3227     renderer, self, artists, self.get_figure(root=True).suppressComposite)
   3229 renderer.close_group('axes')
   3230 self.stale = False

File ~/checkouts/readthedocs.org/user_builds/uxarray/conda/1321/lib/python3.13/site-packages/matplotlib/image.py:134, in _draw_list_compositing_images(renderer, parent, artists, suppress_composite)
    132 if not_composite or not has_images:
    133     for a in artists:
--> 134         a.draw(renderer)
    135 else:
    136     # Composite any adjacent images together
    137     image_group = []

File ~/checkouts/readthedocs.org/user_builds/uxarray/conda/1321/lib/python3.13/site-packages/matplotlib/artist.py:71, in allow_rasterization.<locals>.draw_wrapper(artist, renderer)
     68     if artist.get_agg_filter() is not None:
     69         renderer.start_filter()
---> 71     return draw(artist, renderer)
     72 finally:
     73     if artist.get_agg_filter() is not None:

File ~/checkouts/readthedocs.org/user_builds/uxarray/conda/1321/lib/python3.13/site-packages/matplotlib/collections.py:1008, in _CollectionWithSizes.draw(self, renderer)
   1005 @artist.allow_rasterization
   1006 def draw(self, renderer):
   1007     self.set_sizes(self._sizes, self.get_figure(root=True).dpi)
-> 1008     super().draw(renderer)

File ~/checkouts/readthedocs.org/user_builds/uxarray/conda/1321/lib/python3.13/site-packages/matplotlib/artist.py:71, in allow_rasterization.<locals>.draw_wrapper(artist, renderer)
     68     if artist.get_agg_filter() is not None:
     69         renderer.start_filter()
---> 71     return draw(artist, renderer)
     72 finally:
     73     if artist.get_agg_filter() is not None:

File ~/checkouts/readthedocs.org/user_builds/uxarray/conda/1321/lib/python3.13/site-packages/matplotlib/collections.py:360, in Collection.draw(self, renderer)
    356 renderer.open_group(self.__class__.__name__, self.get_gid())
    358 self.update_scalarmappable()
--> 360 transform, offset_trf, offsets, paths = self._prepare_points()
    362 gc = renderer.new_gc()
    363 self._set_gc_clip(gc)

File ~/checkouts/readthedocs.org/user_builds/uxarray/conda/1321/lib/python3.13/site-packages/matplotlib/collections.py:337, in Collection._prepare_points(self)
    334     offsets = np.ma.column_stack([xs, ys])
    336 if not transform.is_affine:
--> 337     paths = [transform.transform_path_non_affine(path)
    338              for path in paths]
    339     transform = transform.get_affine()
    340 if not offset_trf.is_affine:

File ~/checkouts/readthedocs.org/user_builds/uxarray/conda/1321/lib/python3.13/site-packages/matplotlib/transforms.py:2427, in CompositeGenericTransform.transform_path_non_affine(self, path)
   2425     return path
   2426 elif not self._a.is_affine and self._b.is_affine:
-> 2427     return self._a.transform_path_non_affine(path)
   2428 else:
   2429     return self._b.transform_path_non_affine(
   2430                             self._a.transform_path(path))

File ~/checkouts/readthedocs.org/user_builds/uxarray/conda/1321/lib/python3.13/site-packages/cartopy/mpl/geoaxes.py:174, in InterProjectionTransform.transform_path_non_affine(self, src_path)
    171     return mpath.Path(self.transform(src_path.vertices))
    173 geom = cpath.path_to_shapely(src_path)
--> 174 transformed_geom = self.target_projection.project_geometry(
    175     geom, self.source_projection)
    177 result = cpath.shapely_to_path(transformed_geom)
    179 # store the result in the cache for future performance boosts

File ~/checkouts/readthedocs.org/user_builds/uxarray/conda/1321/lib/python3.13/site-packages/cartopy/crs.py:833, in Projection.project_geometry(self, geometry, src_crs)
    831 if not method_name:
    832     raise ValueError(f'Unsupported geometry type {geom_type!r}')
--> 833 return getattr(self, method_name)(geometry, src_crs)

File ~/checkouts/readthedocs.org/user_builds/uxarray/conda/1321/lib/python3.13/site-packages/cartopy/crs.py:836, in Projection._project_point(self, point, src_crs)
    835 def _project_point(self, point, src_crs):
--> 836     return sgeom.Point(*self.transform_point(point.x, point.y, src_crs))

File ~/checkouts/readthedocs.org/user_builds/uxarray/conda/1321/lib/python3.13/site-packages/shapely/geometry/point.py:91, in Point.x(self)
     88 @property
     89 def x(self):
     90     """Return x coordinate."""
---> 91     return float(shapely.get_x(self))

File ~/checkouts/readthedocs.org/user_builds/uxarray/conda/1321/lib/python3.13/site-packages/shapely/decorators.py:88, in multithreading_enabled.<locals>.wrapped(*args, **kwargs)
     86     for arr in array_args:
     87         arr.flags.writeable = False
---> 88     return func(*args, **kwargs)
     89 finally:
     90     for arr, old_flag in zip(array_args, old_flags):

File ~/checkouts/readthedocs.org/user_builds/uxarray/conda/1321/lib/python3.13/site-packages/shapely/_geometry.py:298, in get_x(point, **kwargs)
    273 @multithreading_enabled
    274 def get_x(point, **kwargs):
    275     """Return the x-coordinate of a point.
    276
    277     Parameters
   (...)    296
    297     """
--> 298     return lib.get_x(point, **kwargs)

GEOSException: UnsupportedOperationException: getX called on empty Point
<Figure size 640x480 with 1 Axes>
Visualize Grid Topology with LineCollection#
To visualize the unstructured grid geometry, you can convert a Grid into a LineCollection, which stores the edges of the unstructured grid.
Important
Since the transform for the LineCollection and PolyCollection are set to ccrs.Geodetic(), the edges and polygons are drawn correctly on the surface of a sphere and properly at the antimeridian.
line_collection = uxds.uxgrid.to_linecollection(colors="black", linewidths=0.5)
fig, ax = plt.subplots(
    1,
    1,
    constrained_layout=True,
    subplot_kw={"projection": ccrs.Robinson()},
)

ax.add_feature(cfeature.LAND)
ax.add_feature(cfeature.COASTLINE)
ax.add_collection(line_collection)
ax.set_global()
ax.set_title("LineCollection")
plt.show()